
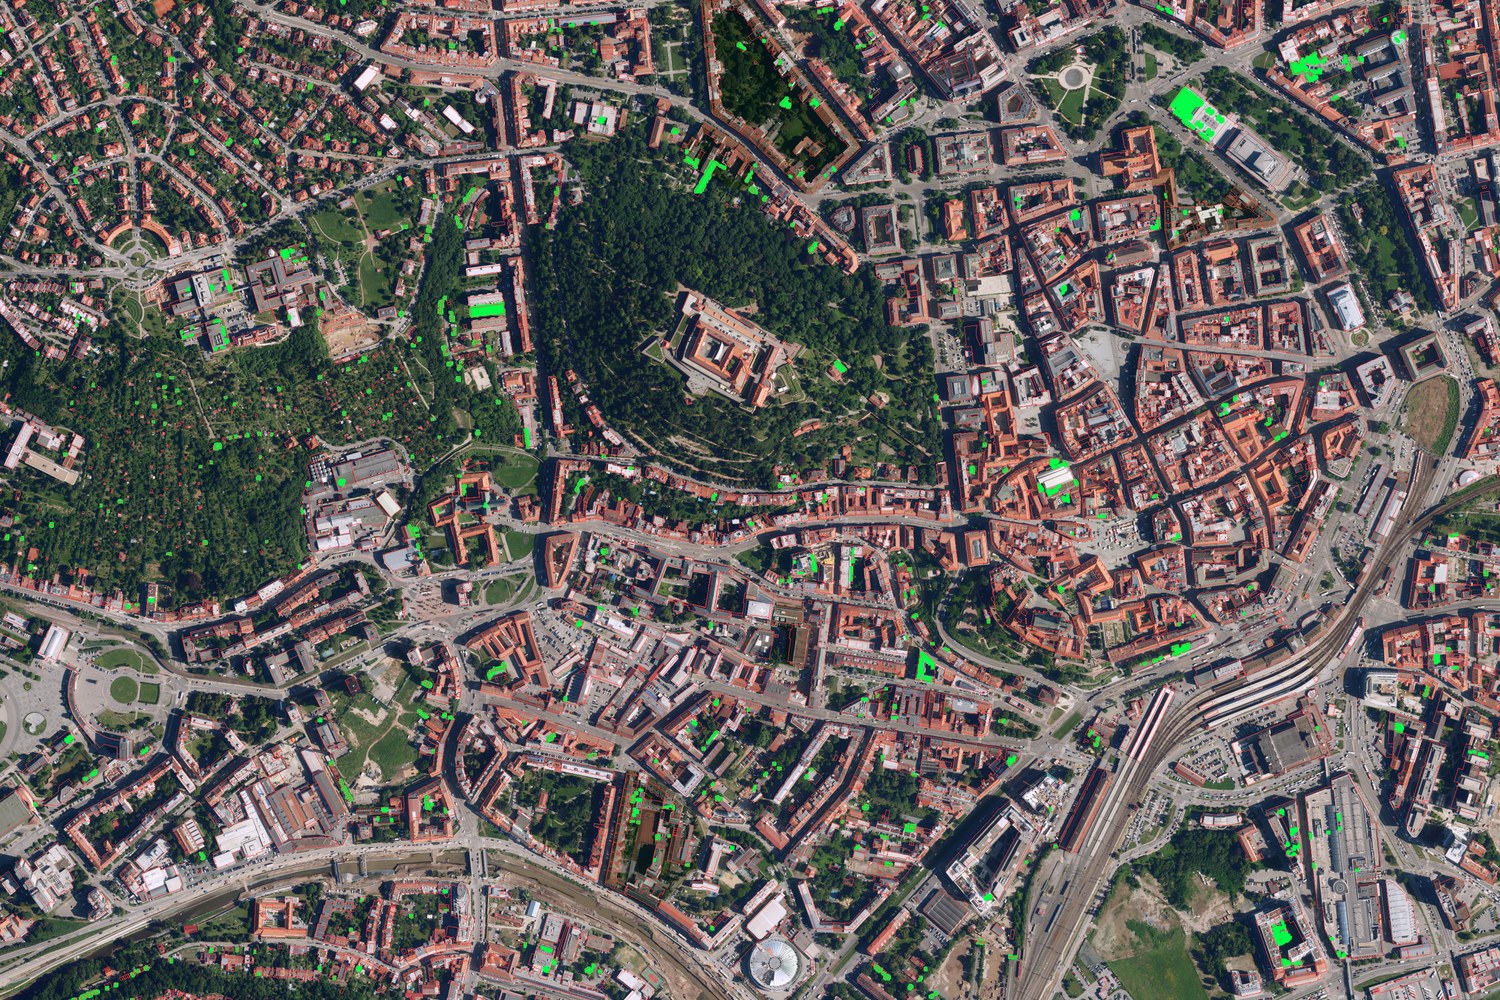
I wanted to know how many roofs in Brno have plants on them, and if that number is going up. So I counted them from aerial photos over 4 years. The photos are free to use, you only have to say where they came from. Here is how I did it, and where it goes wrong.
The photos
All the photos are Ortofoto ČR from ČÚZK, the Czech state mapping office. ČÚZK flies over half the country each year. Brno is in the east half, so it gets photographed in even years. Each year is one seamless photo mosaic. So there is exactly 1 photo of each place per year, not many.
I kept 4 years: 2016, 2020, 2022 and 2024. I dropped 2018, since it was flown on 12 August, much later than the rest. I dropped years before 2016 too, since their pixels are bigger and blurrier. Each sheet has its own flight date, and the ones below are for the city centre. Other sheets differ by a few days.
| year | city centre flown | pixel size |
|---|---|---|
| 2016 | 23 May | 0.2 m |
| 2020 | 1 Jul | 0.2 m |
| 2022 | 5 Jun | 0.125 m |
| 2024 | 17 Jun | 0.125 m |
The whole city is 76 map sheets, each 2.5 × 2 km. That is about 68 billion pixels in total.
The method, in short
To know which pixels are a roof, I need building outlines. I use RÚIAN, the Czech building register, for the current outlines (garages included). I fuse it with OpenStreetMap history, so for each year I know which buildings existed back then. Only buildings inside Brno city limits count. That is 83 062 buildings.
The photos differ in colour from year to year. So I first colour-match every year to 2024. I fit a simple per-channel line on pixels that should not change, like pavement and grey roofs.
Then 2 detectors look at each roof pixel and say “plant or not”:
- Pixel colour rule ‒> looks at hue and greenness of each roof pixel. I hand-labelled 460 roofs to tune it. Best score: F1 = 0.82 (precision 0.94, recall 0.73).
- SAM (Segment Anything Model) ‒> gets each building outline as a box prompt, cuts the roof into parts, then I keep only the green parts. I also tried a text prompt “green roof”. It flagged 86-94% of the whole image as green, so I threw it out.
Both detectors work on the same 0.5 m grid. A roof counts as green when it has at least 1 m² of plants.
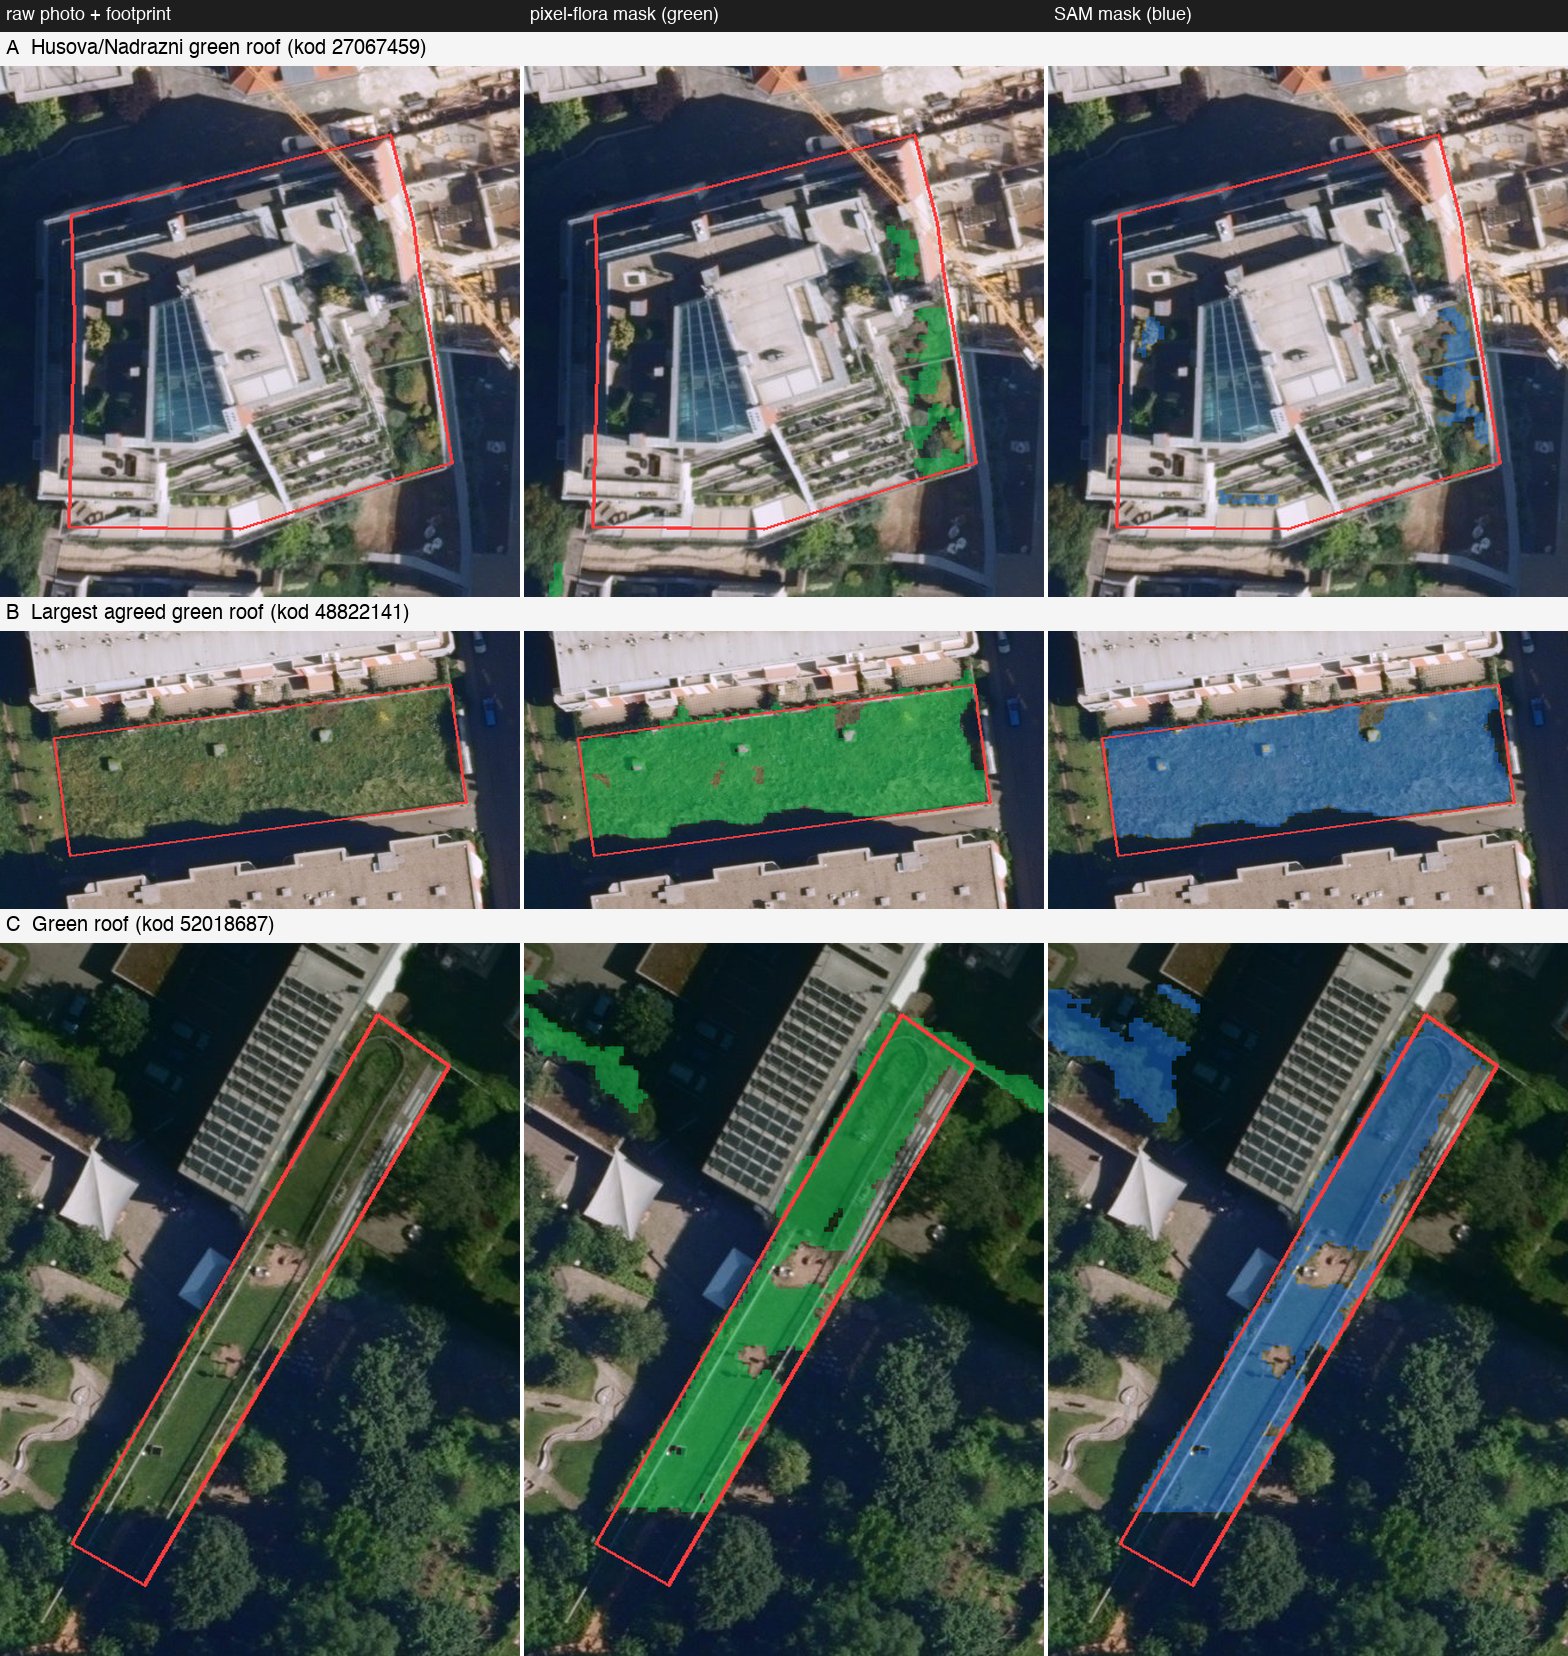
The pixel rule hugs the true edge of the plants. SAM fills whole roof parts, and now and then bleeds onto a tree next door.
Building up the count
First, a simple count. How many buildings have at least 1 m² of plants on the roof each year? There are 3 lines: the pixel rule, SAM, and both. Both means each detector finds 1 m² on its own.
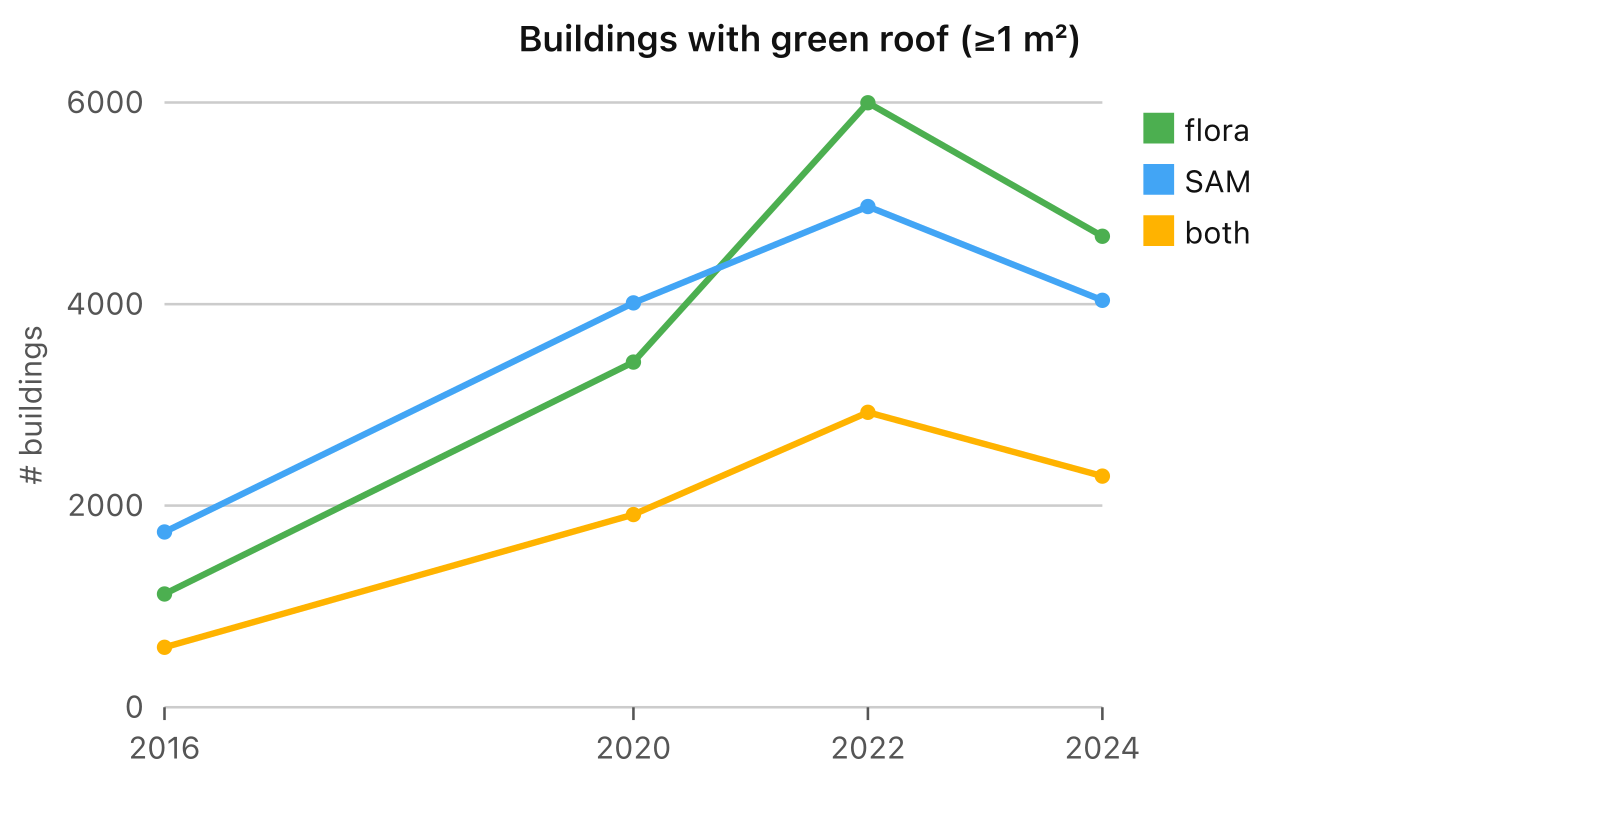
| year | pixel rule | SAM | both |
|---|---|---|---|
| 2016 | 1 124 | 1 740 | 596 |
| 2020 | 3 424 | 4 011 | 1 911 |
| 2022 | 5 997 | 4 967 | 2 926 |
| 2024 | 4 673 | 4 037 | 2 292 |
The jump from 2016 is partly real and partly the photo. 2016 was flown in late May. Plants are still pale then. And 1 photo is noisy. A shadow, a wet patch or a tarp can look green.
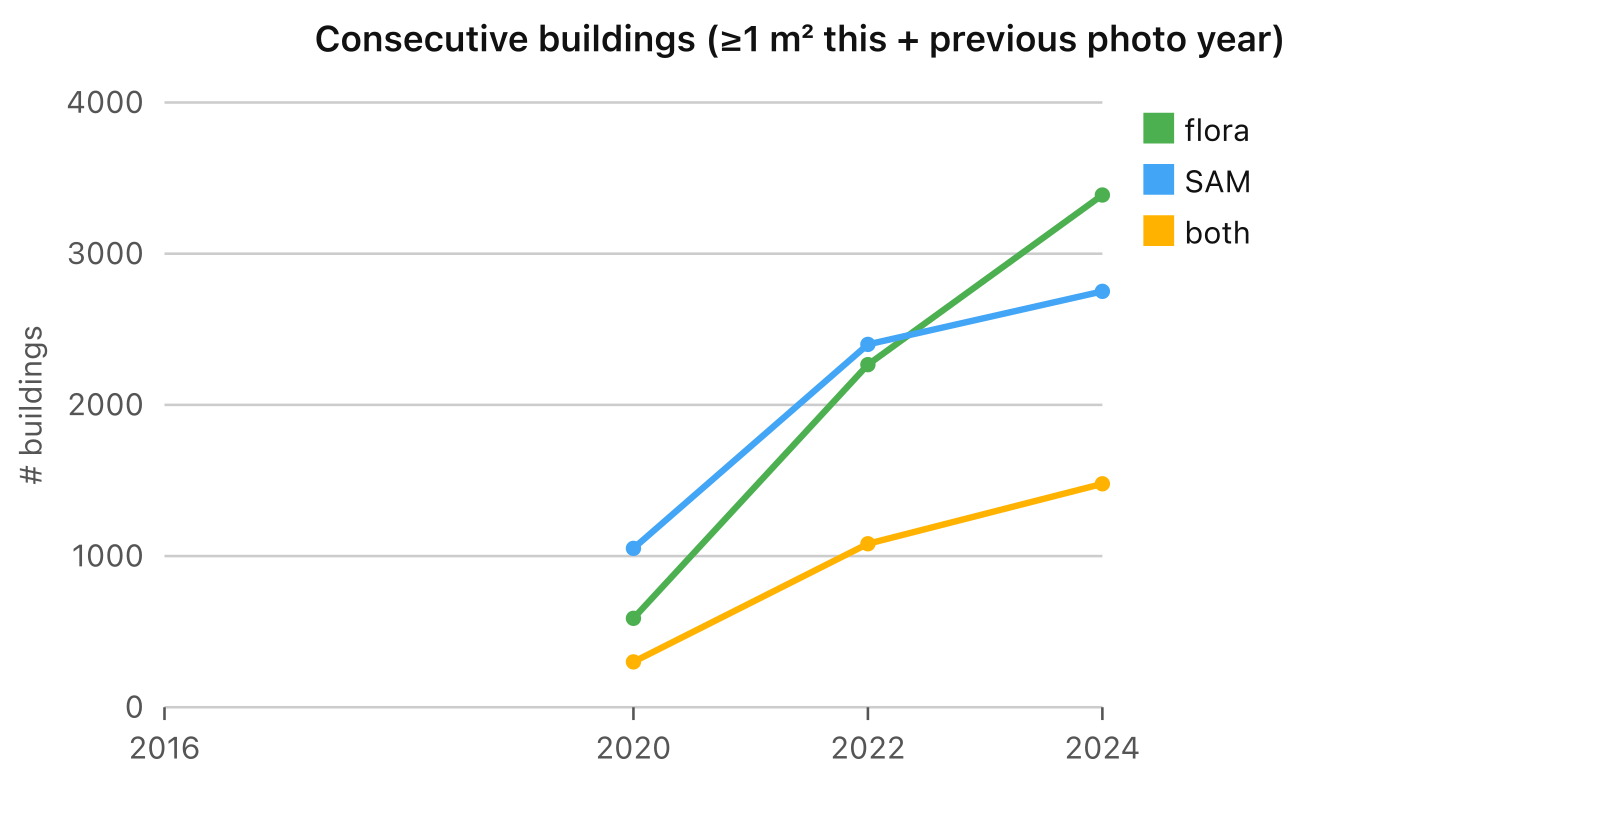
So I add a stricter rule. A roof only counts if it was green in 2 photos in a row. That is this year and the one before.
And a stricter one still: green in 3 photos in a row.
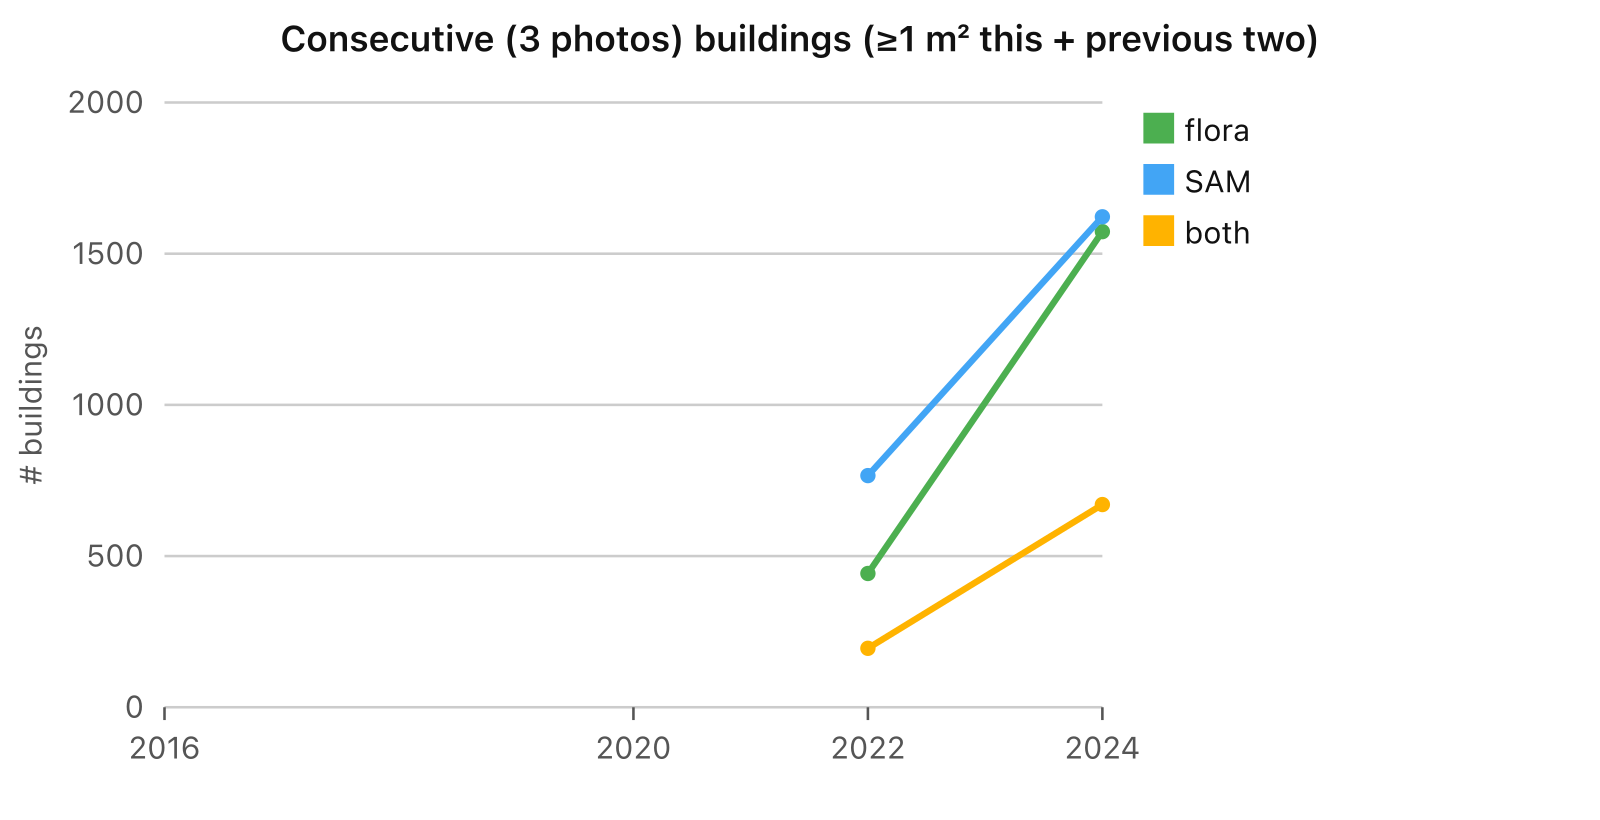
| year | both, 2 in a row | both, 3 in a row |
|---|---|---|
| 2020 | 300 | – |
| 2022 | 1 082 | 195 |
| 2024 | 1 478 | 670 |
Now the chart I care about. It counts square metres, not roofs. It only uses roofs that both detectors flag in 2 photos in a row. And it comes as a band. The lower bound is the area where SAM and the pixel rule agree. The upper bound is the area where either one says green.
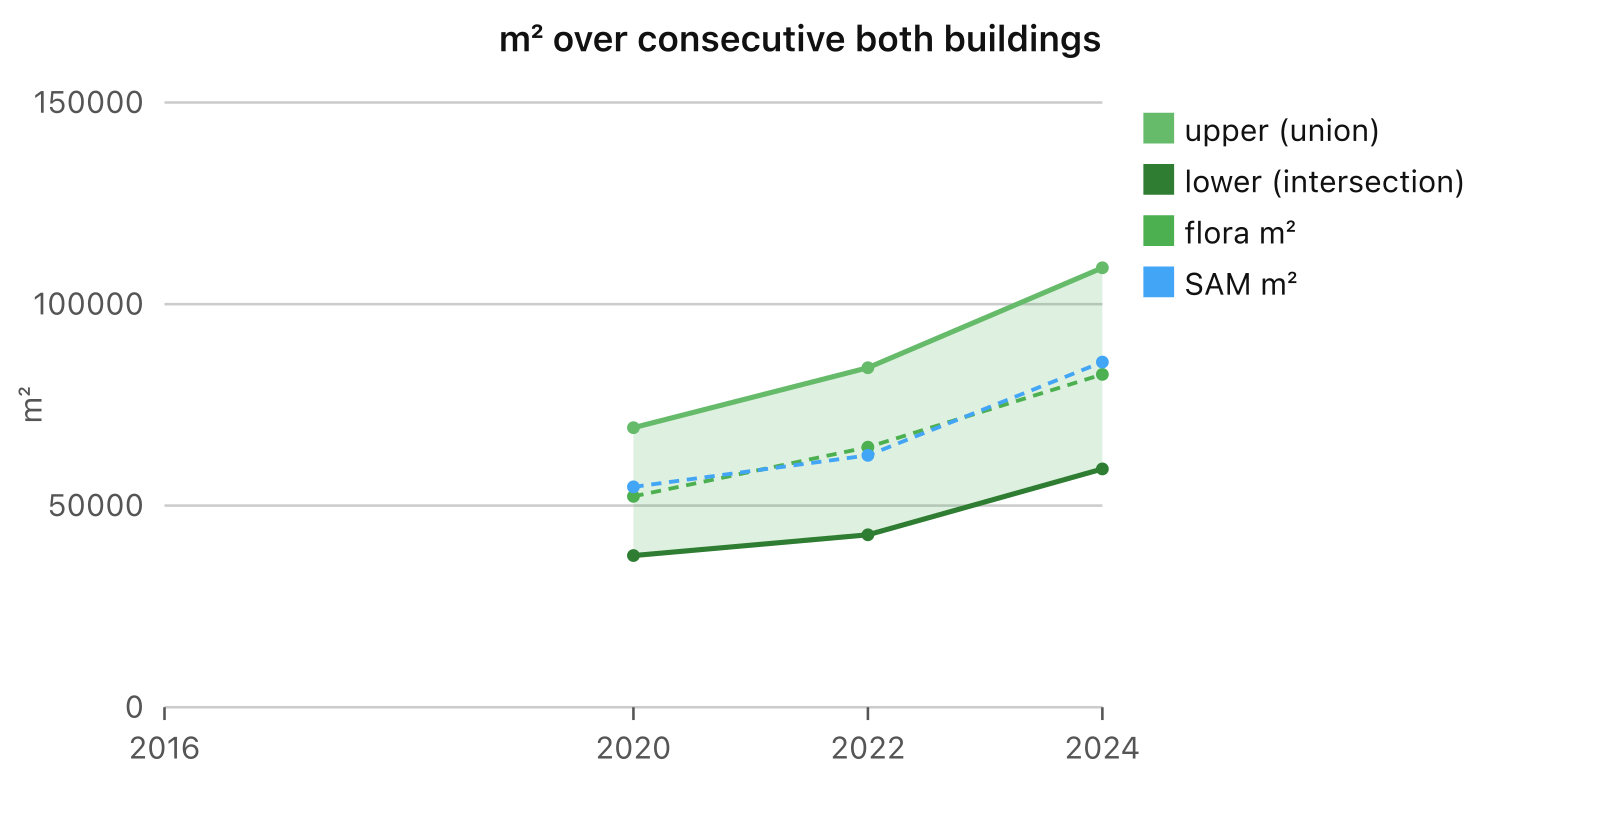
| year | lower bound | upper bound |
|---|---|---|
| 2020 | 37 650 m² | 69 337 m² |
| 2022 | 42 750 m² | 84 226 m² |
| 2024 | 59 093 m² | 109 024 m² |
So in 2024 Brno had 5.9 to 10.9 hectares of stable green roof. That is about 8 to 15 football pitches. The band grew by about half since 2020, at both ends. The trend is up, even if the exact number is soft.
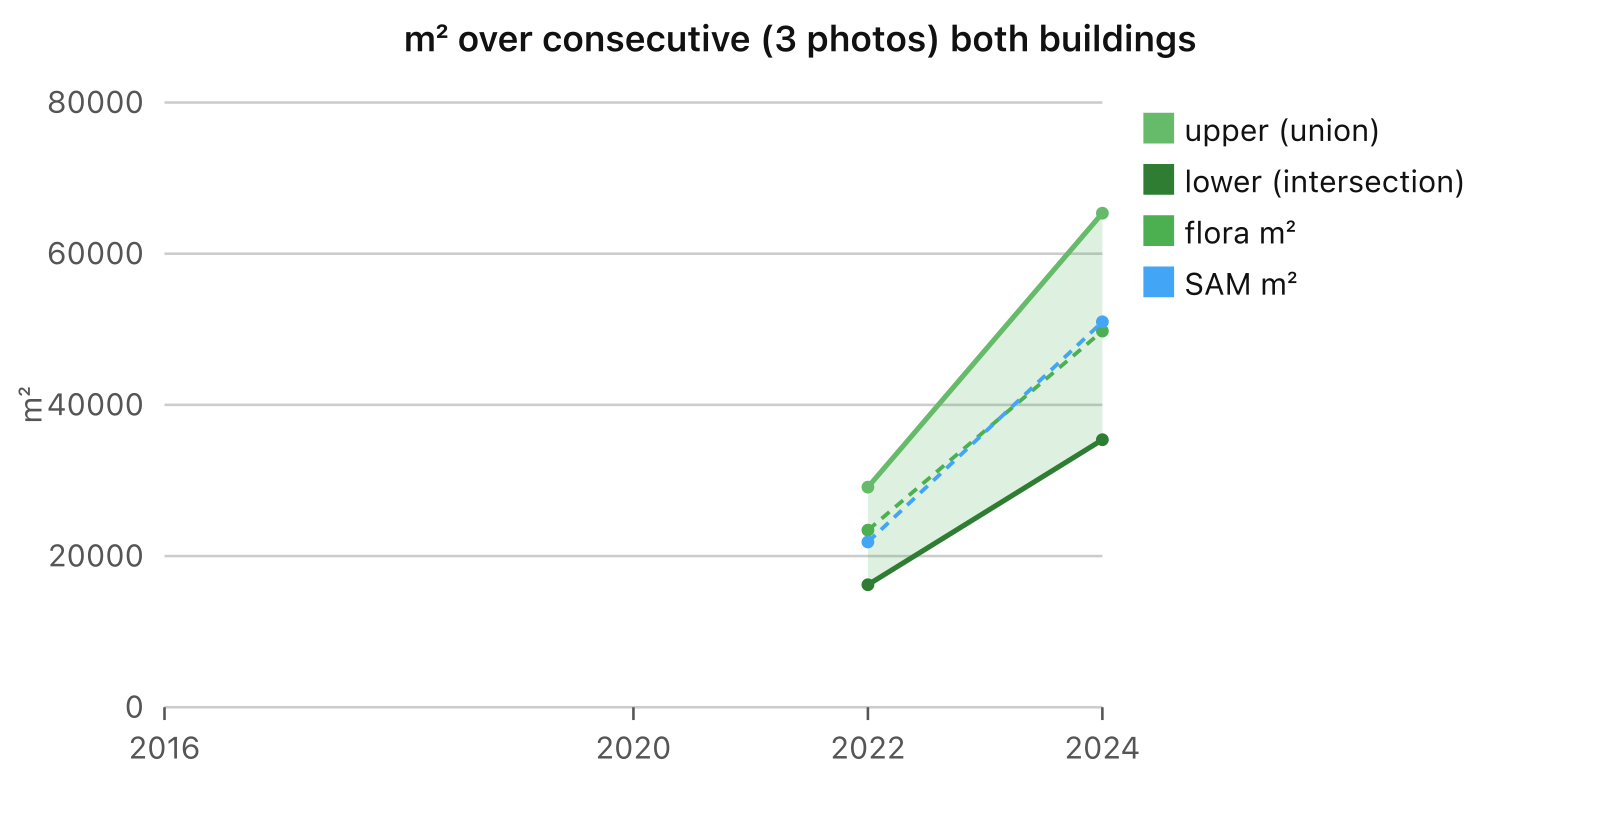
The 3-in-a-row version is smaller, 3.5 to 6.5 hectares in 2024. But it points the same way.
Where this goes wrong
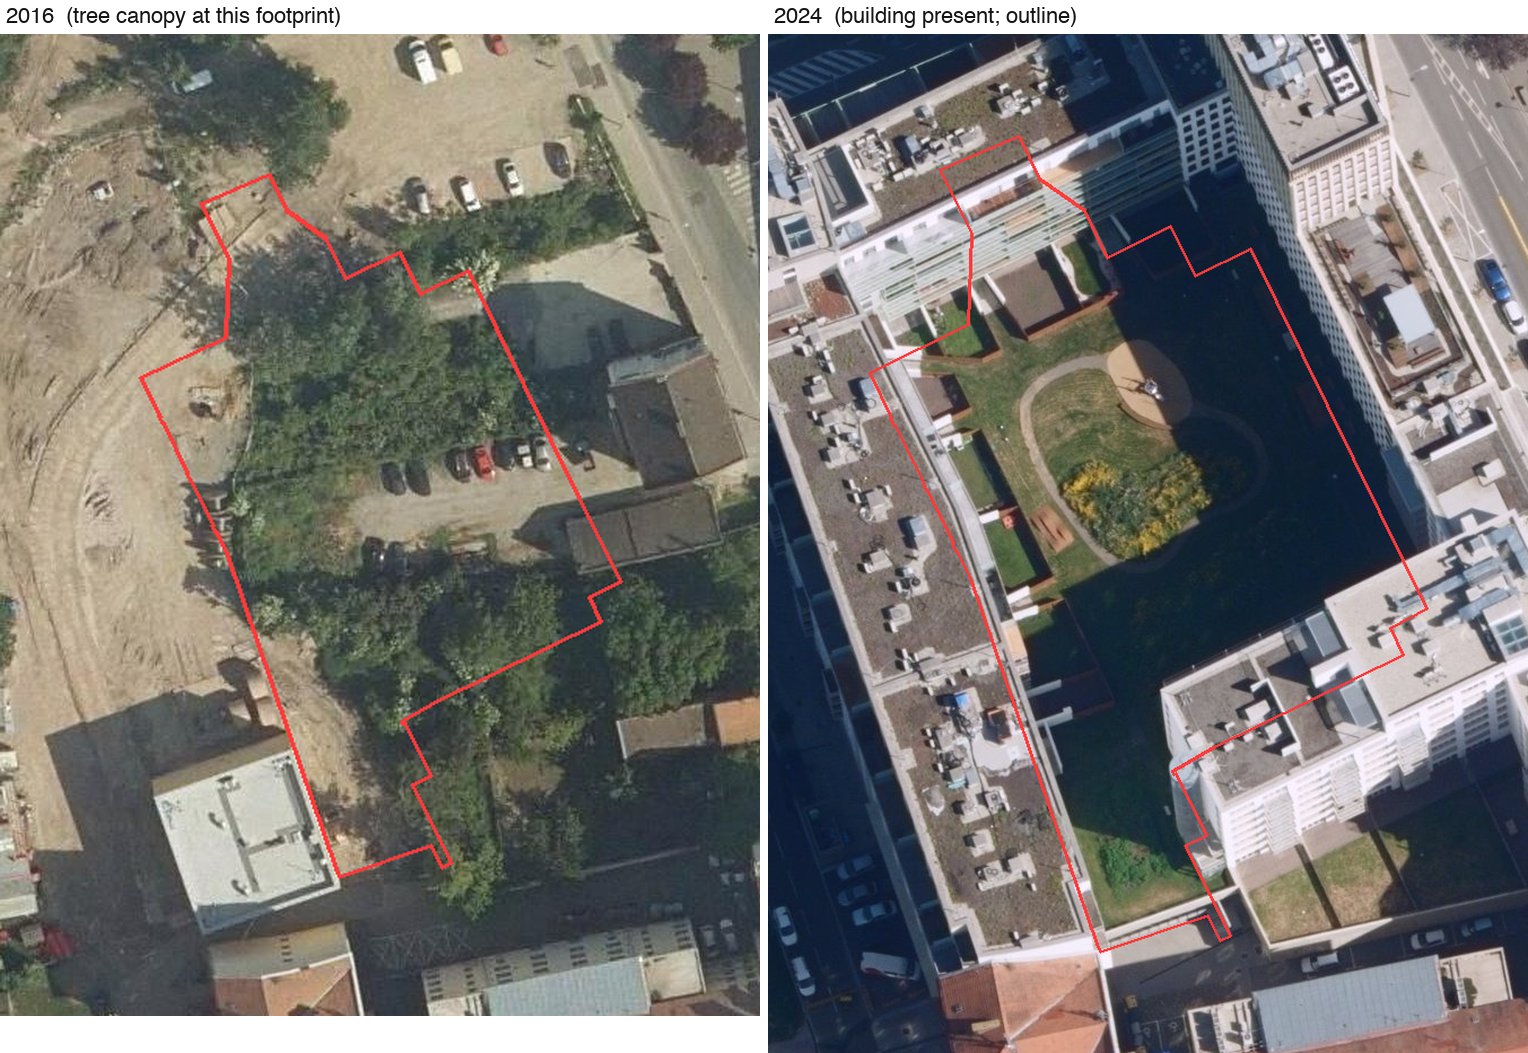
The biggest problem: I have no true history of building outlines. OSM history helps, but it is patchy. Where a tree stood before a building was built, the older photo shows tree tops inside today’s outline. My detectors do not know if a plant is on a roof or next to it. So the tree counts as a green roof.
Other things that go wrong:
- Trees hanging over real roofs count as roof plants.
- Different months. 2016 was late May, 2020 was July. Plants look different across the season, and so does the count.
- Sedum roofs are often yellow, red or brown, not green. A colour rule misses them. So the real number is likely higher.
- JPEG artefacts and pixel size (0.2 m vs 0.125 m) change what the detectors see from year to year.
- The pixel rule was tuned on the city centre only.
- No height data. With LiDAR I could check that the green stuff is really up on the roof.
- Green tarps, pools and painted roofs fool a colour rule now and then.
Future work
The detectors should be fine-tuned on roofs picked by hand, by a professional with care, not just by me in an evening. The 1 m² threshold is very low. Moving it up to 10 or 20 m² would cut most of the noise from tarps and tree tips. And a height model from LiDAR would settle if the green is on the roof at all.
Data and attribution
- Aerial photos: Ortofoto ČR © ČÚZK ‒> geoportal.cuzk.cz
- Building outlines: RÚIAN © ČÚZK
- Building history: © OpenStreetMap contributors, ODbL